Big Rivers

Total workforce 9,435
(2021)
2.2% increase since 2020
Big Rivers
Total workforce 9,435
(2021)
2.2% increase since 2020

Population (2021)
by age, gender and Indigenous status
Total 18,944
0.5% decrease since 2016
| Age | Male | Female | Indigenous |
|---|---|---|---|
| 0-24 | 16% | 15% | 47% |
| 25-44 | 15% | 14% | 30% |
| 45-64 | 13% | 13% | 18% |
| 65+ | 8% | 6% | 5% |
Total of 3,360 VET students
(2021)
7.3% increase since 2020
Top 3 Qualifications
- Cert II in Resources And Infrastructure Work Prep.
- Cert III in Civil Construction Plant Operations
- Cert II in Construction
45%
2021
55%
- Total of
2,235 program enrolments
- Majority:
25 to 44 years (48%)
- Previous highest level of education:
Year 11 or lower (30%)
- Indigenous status: 35%
- Government funded: 46%
Workforce
Total Apprentices/Trainees (2022): 377
= 4% of total workforce
Total registered businesses (2021): 975
= 6% increase since 2020
Total industries (2021):
19
(incl. Industry not classified)
Top 5 industries by workforce total

Workforce
= 69% of
working population
(15-64 years)

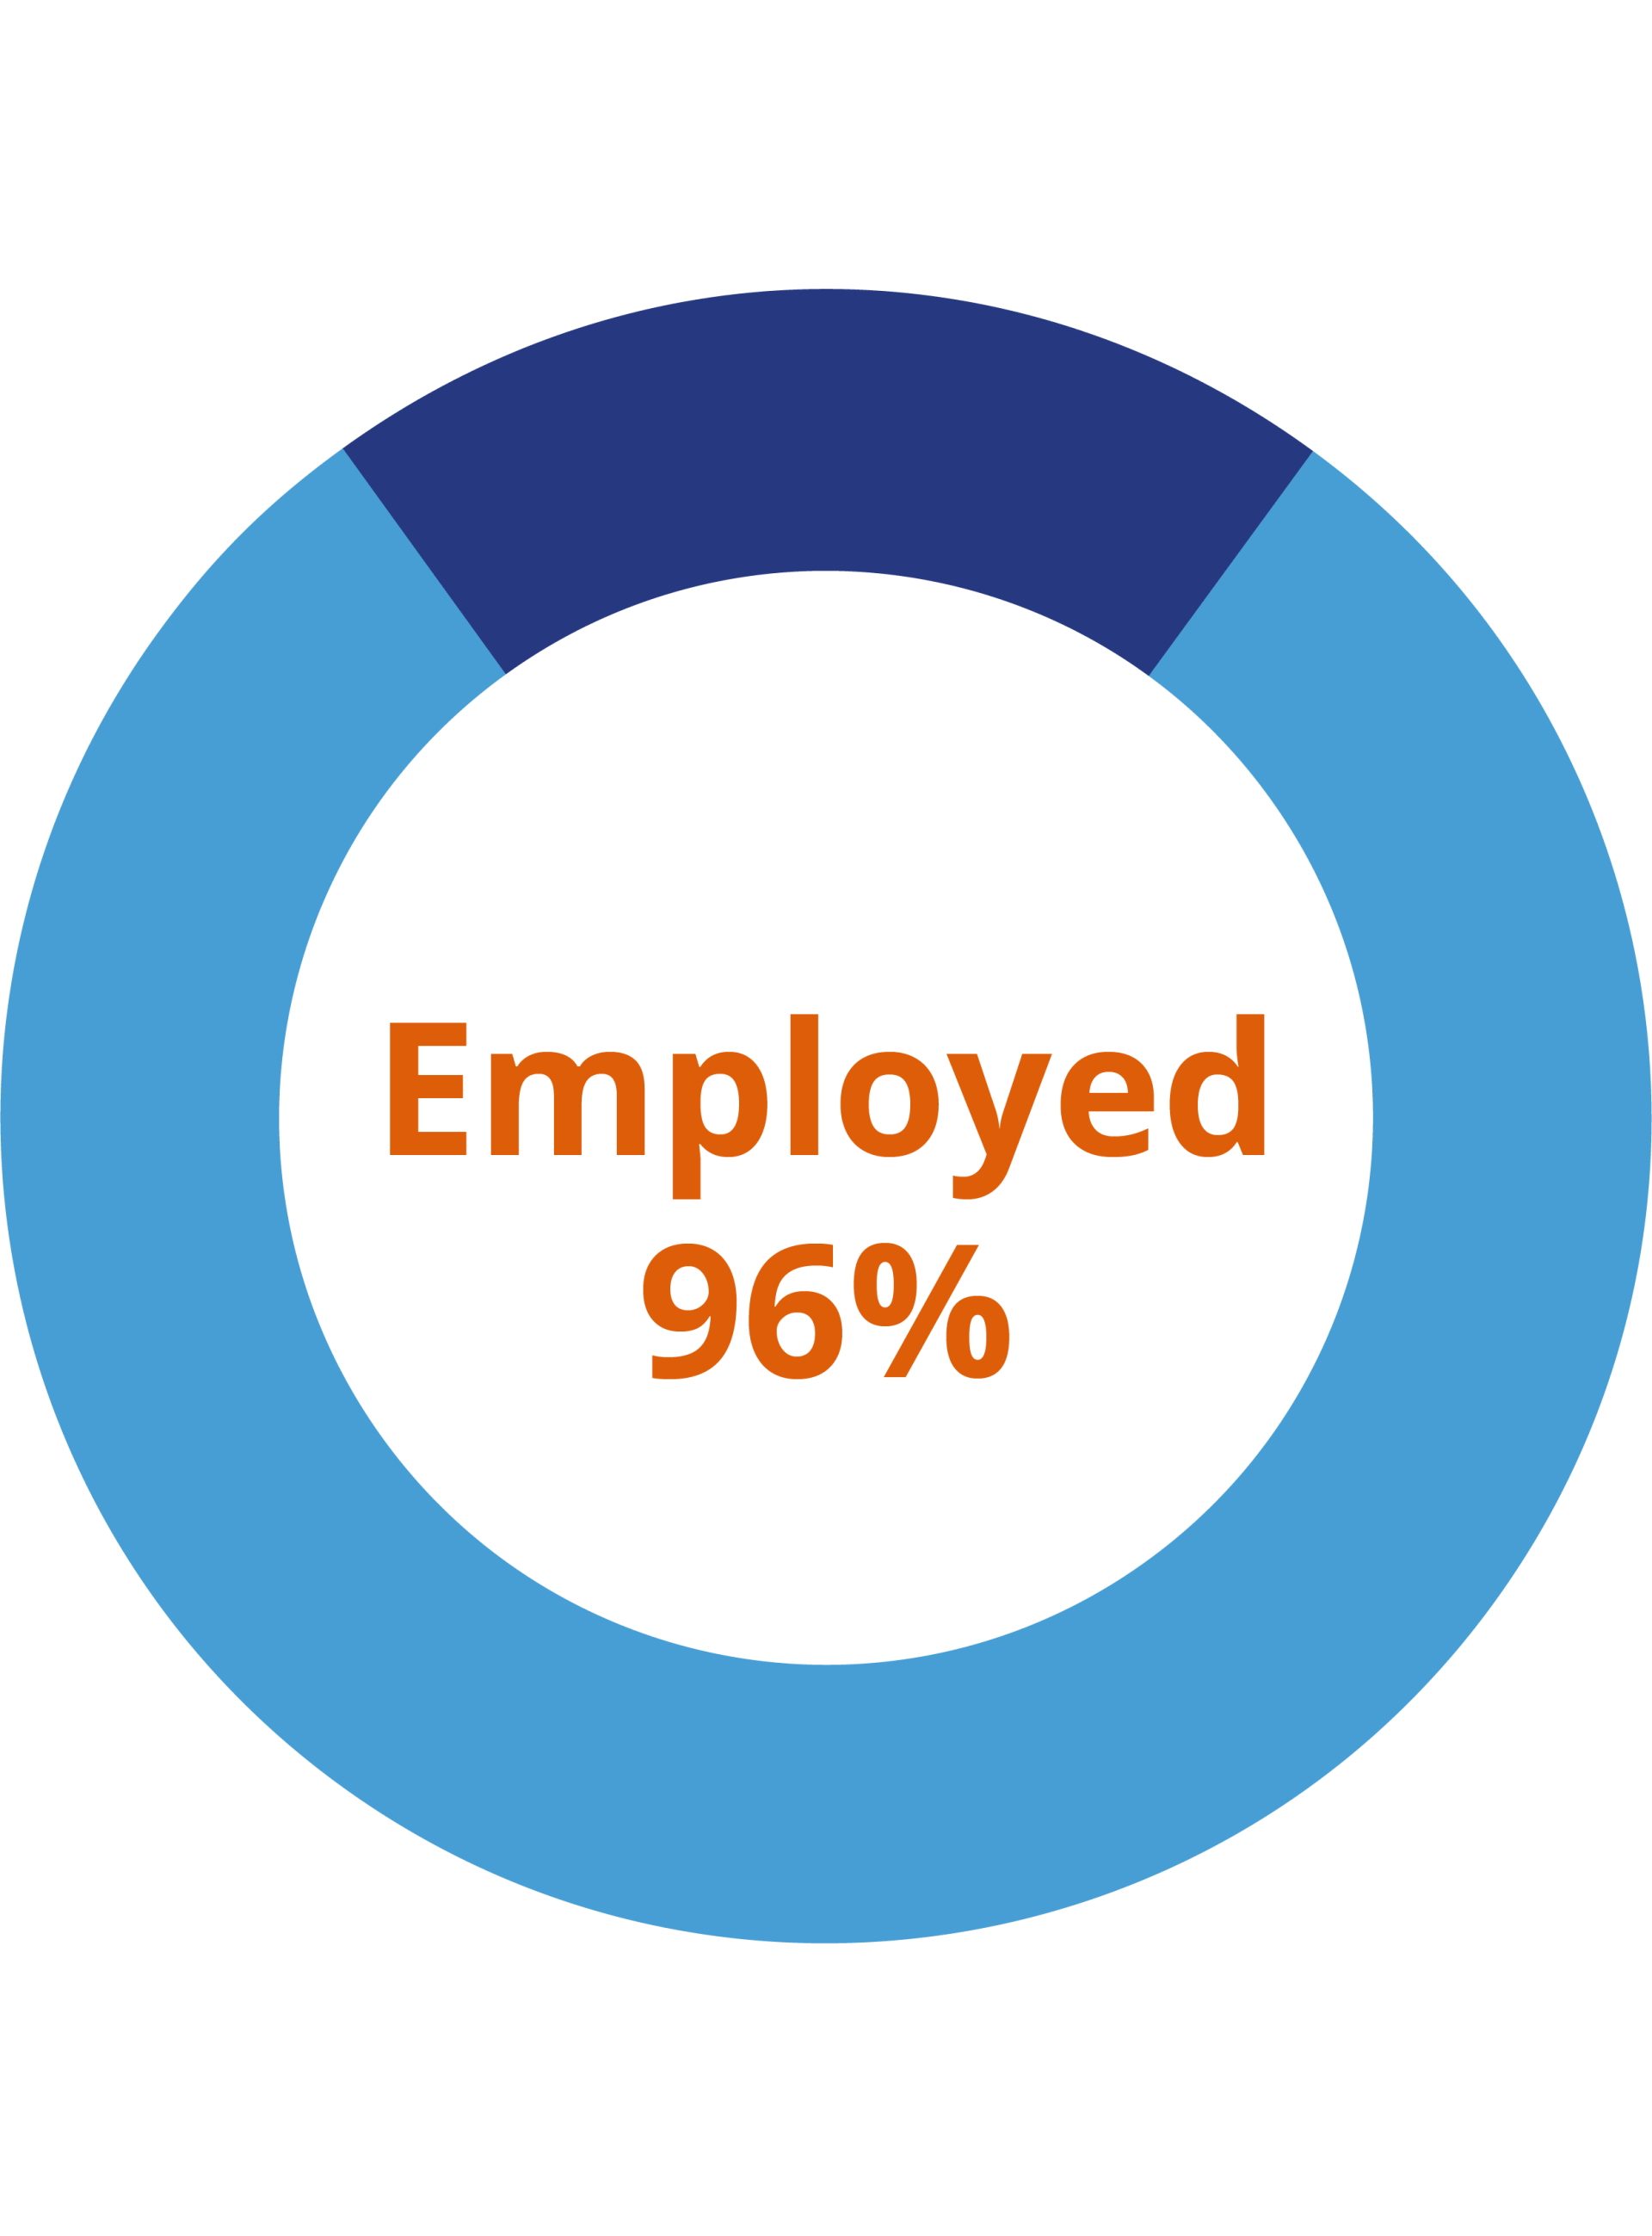
Unemployment rate
(March 2022) =
5.5%
= 0.2%
increase since
March 2021
Top 3 Occupations
selected by VET students (2021)
- Earth Moving Plant Operators
- Welfare Support Workers
- Building and Plumbing Labourers
Examples of Occupations & Skills in Demands (2021)
Occupations
- Welfare Centre Manager
- Mixed Crop Farmer
- Retail Pharmacist
- Truck Driver
- Automotive Electrician
Skills
- Supervision
- Technical/vocational
- Coaching & mentoring
- Small business operations
- Leadership & management
Workforce Challenges
- Employee dissatisfaction with employment status
- Higher interstate relocation costs
- Lack of training for employees
- Low locally skilled workforce
Impact of Automation

The percentage of job tasks predicted to be performed by technologies
Impact of Augmentation

The percentage of value addition to job tasks by technologies
Workforce Solutions
- Migration strategy
- Upskilling current workforce
- Workforce mobilisation planning
- Attraction and retention strategy
- Apprenticeships and traineeships pathways
Transferable Occupations
Example:
Training an Apiarist to become a Mixed Crop Farmer with a skills match of 82%
Mixed Crop
Farmer
- Apiarist (82% Job Fit)
- Dairy Cattle Farmer (82% Job Fit)
- Horse Breeder (82% Job Fit)
Retail
Pharmacist
- Traditional Chinese Medicine Practitioner (80% Job Fit)
- Medical Technicians (77% Job Fit)
- Natural Remedy Consultant (58% Job Fit)